


Development Impact in FY21
FY21 Gross Issuance

- 1
- 2
- 3
- 4
-
$1,706.5 M
Europe and Central Asia
-
$522.7 M
East Asia and Pacific
-
$512.5 M
Sub-Saharan
-
$2,457.5 M
Latin America and the Caribbean
$5,199 M Total Gross Issuance
Country Results
*Figures reflect projects signed in FY15–21

- A
- B
- C
- D
- E
- F
- G
- H
-
KOSOVO
$159,591,650
Total loans supported
-
EGYPT
11,717
Jobs supported (permanent and temporary)
-
bangladesh
9,664,349
People provided with new or improved electricity service
-
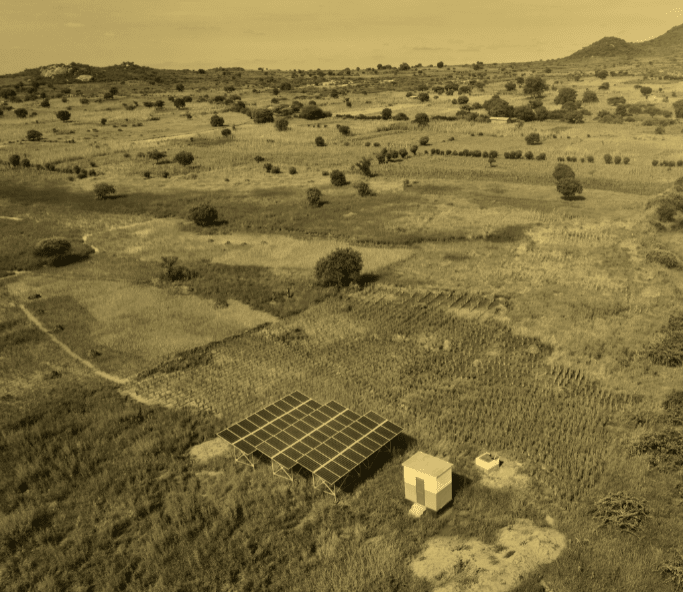
kenya
93,750
GHG avoided (tCO2e/yr)
-
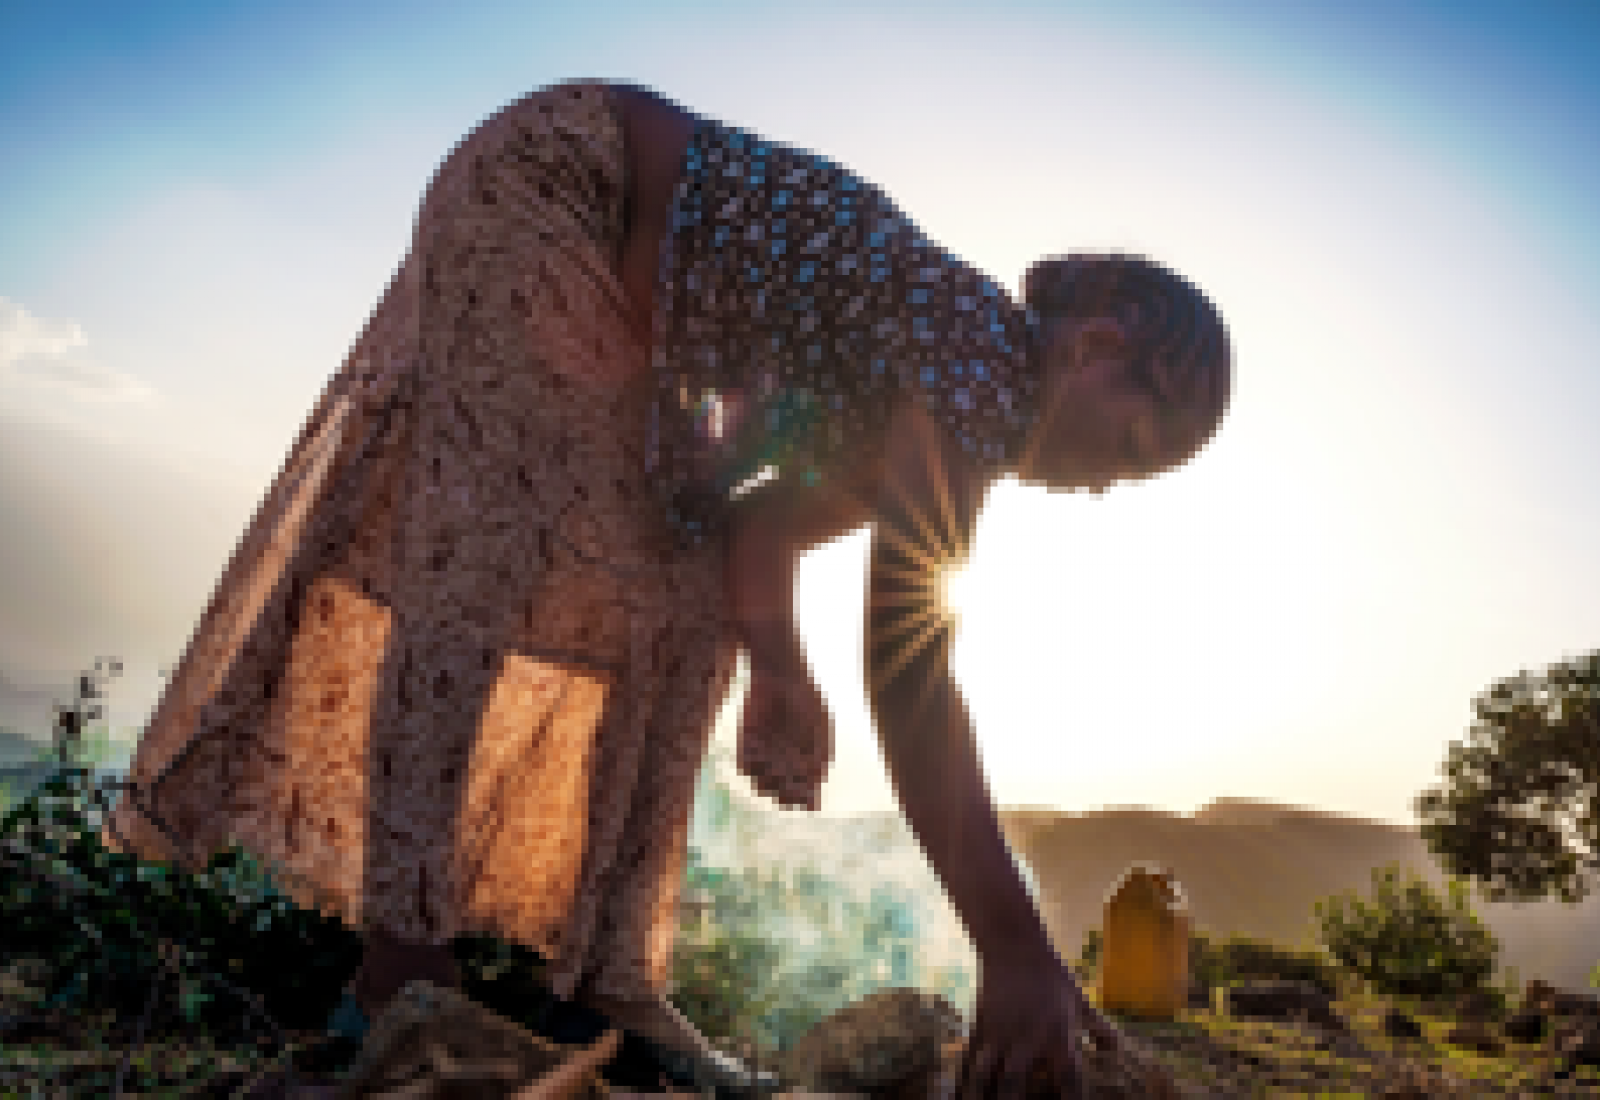
rwanda
275,000
People provided with new or improved electricity service
-
colombia
$180,5000,000
Taxes and fees
-
ecuador
$22,3000,000
Locally procured goods
-
zambia
589,248
GHG avoided (tCO2e/yr)
14,597
Total employment supported (permanent + temporary)
US$ 53.9 million
Locally procured goods per year
US$ 362 million
Taxes and fees paid per year to host governments
1,580 MW
Power: installed capacity
11,671 GWhs
Expanded power generation per year
784,000
People provided with new or improved electricity service
306,027
GHG emissions avoided (tCO2e/year)
US$ 1.3 billion
Volume of loans supported
US$ 5.5 billion
Total activity financing


